Why is this functionality useful?
This unification streamlines your workflow and significantly improves navigation efficiency. By consolidating all relevant instrument data and configuration actions, users can:
-
Access essential information at a glance.
-
Switch seamlessly between viewing, editing, and monitoring instrument details.
-
Reduce the time spent navigating multiple sections.
Feature Highlights
-
Persistent Header: The most important instrument details remain visible across all tabs.
-
Instrument Name
-
Category & Type
-
Original Instrument ID
-
State (Active / Inactive)
-
Alert Status (based on the project alert configuration)
-
Data Reception Status (Receiving / Not receiving / Not configured)
-
Associated Sites and Groups
-
-
Tabbed Interface: All functionality is now organized into a clear, logical set of tabs:
-
Overview (Instrument Dashboard) – View a high-level summary of the instrument’s status and recent activity.
-
History – Displays the complete history list, identical to the previous instrument details section.
-
Documents – Access the full list of associated documents.
-
Annotations – Review and manage all annotations linked to the instrument.
-
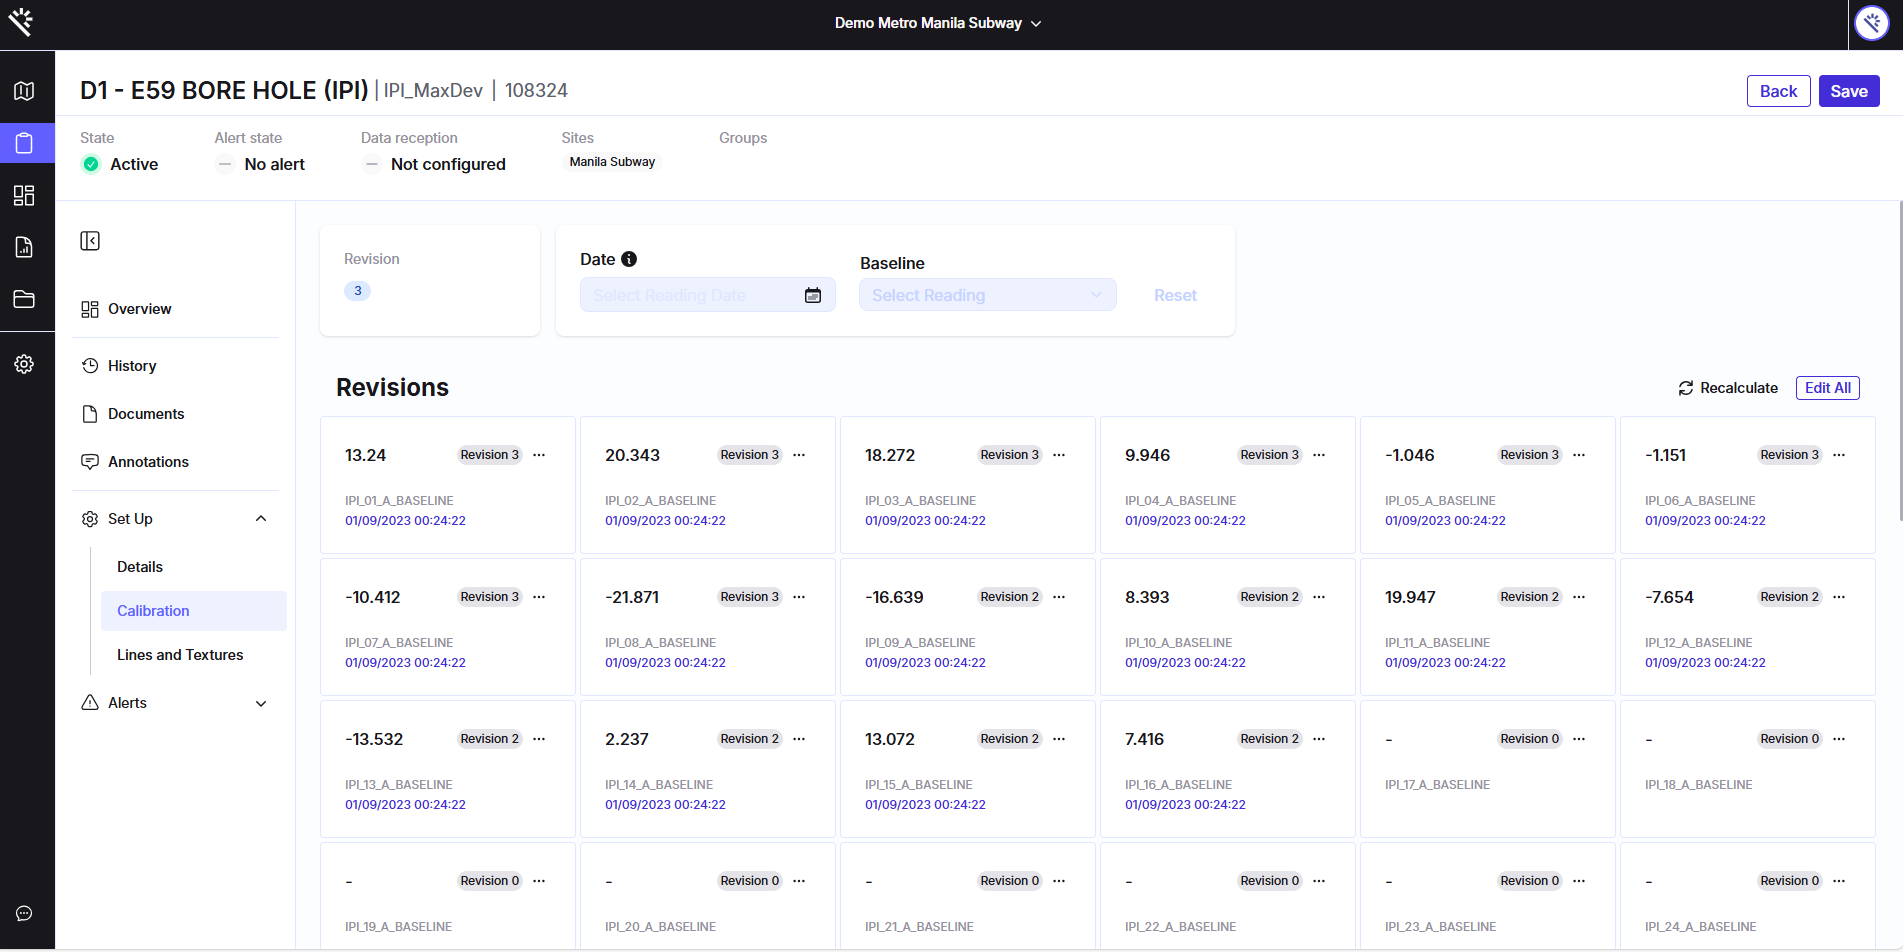
Setup (Configuration Hub) – The central area for setup and calibration:
-
Configuration: Main setup view for instrument parameters.
-
Calibrations: Now presented in a streamlined table view instead of the previous box layout.
-
Lines & Textures: Retains the familiar configuration options from the previous setup.
-
-
Alerts: Organized into two parts for better clarity:
-
Alert History: Table view of past alerts, scoped to the current instrument.
-
Alert Setup (Thresholds): Manage thresholds using intuitive field-switching controls and dropdown menus.
-
Outliers: Define limits to automatically remove erroneous readings.
-
-
Data Reception: Also presented in two segments:
-
Setup: Configure data reception settings (same as before).
-
History of Data Reception Alerts: Simple table showing alert-triggered dates for reception issues.
-
-
How does it work?
- Access the Unified View: Open any instrument, and you’ll now see all information consolidated under one unified interface.
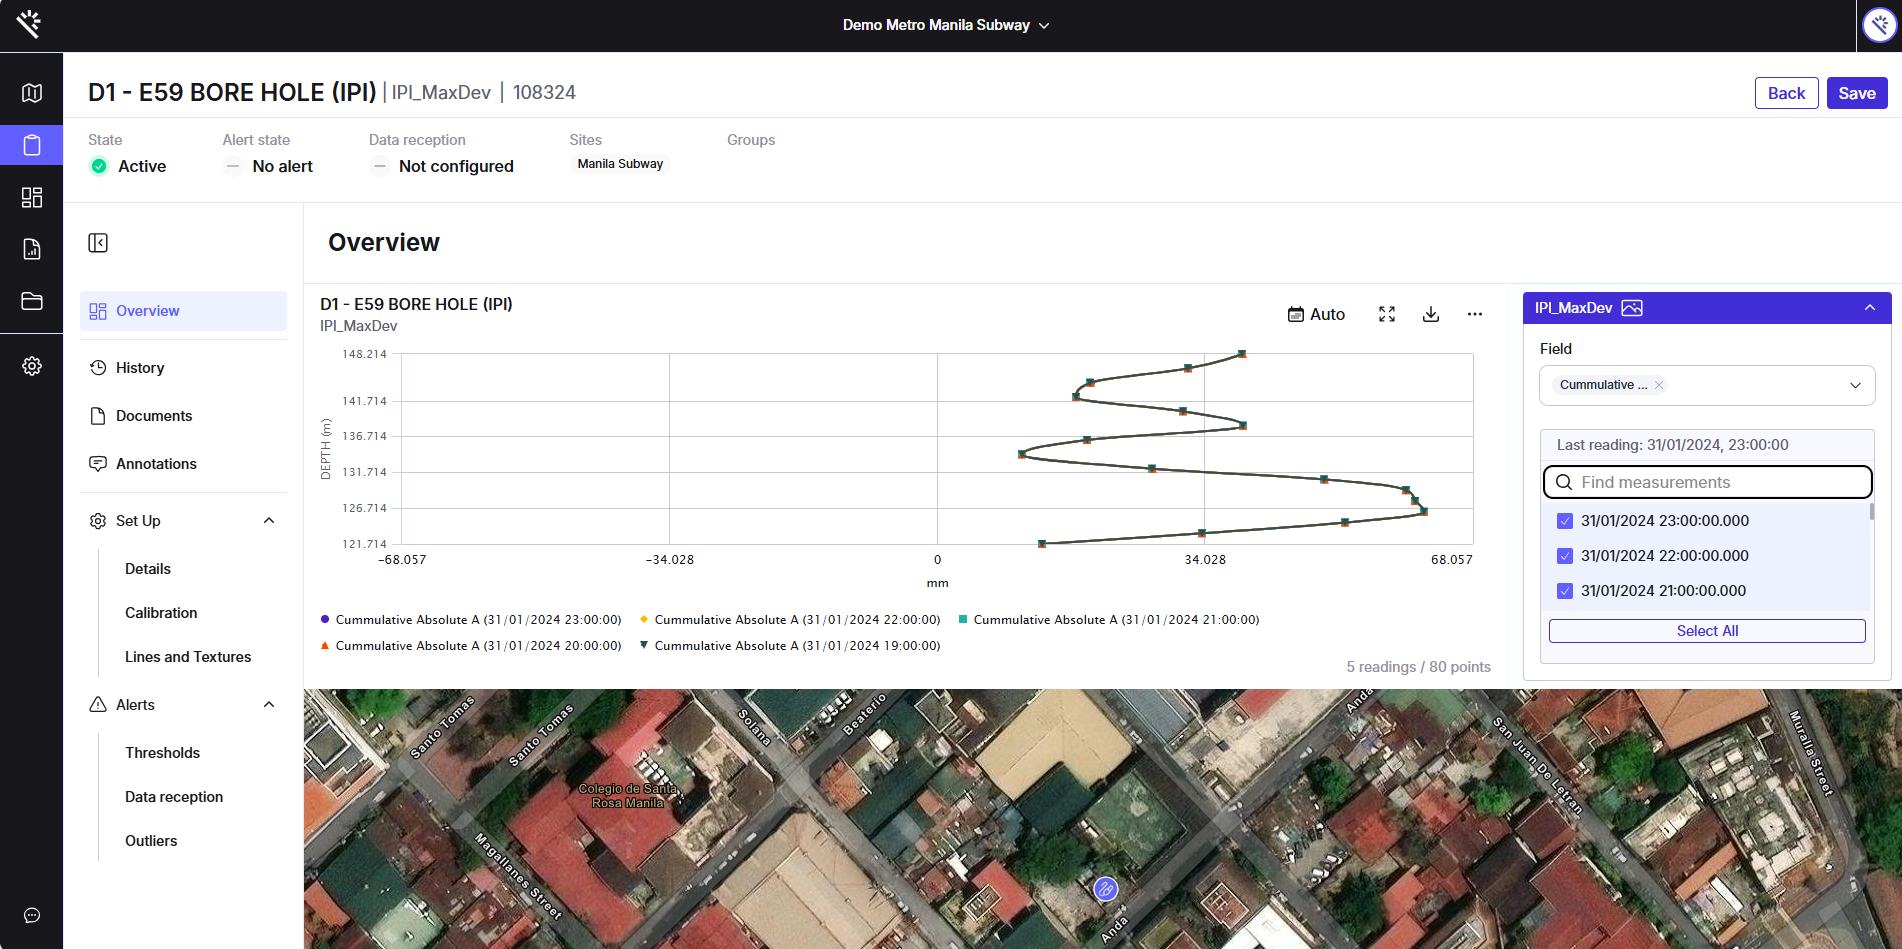
- Review Key Details: The persistent header at the top ensures that identification and status details are always visible. This allows users to quickly assess alert status, data reception issues, and instrument active status.

- Navigate Through Tabs: Use the new tab bar to switch between Overview, Setup, Alerts, and other sections. Each tab focuses on a specific type of data or configuration, reducing clutter and improving usability.
- Update and Manage Configurations: All setup and calibration actions are centralized under the Setup tab, with simplified table layouts for faster updates.