Why Is This Functionality Useful?
-
Saves time by instantly activating commonly used data calculations.
-
Provides clearer insights into data behaviour with no setup needed.
-
Supports multi-selection for broader comparative analysis.
-
Reduces the risk of configuration errors by using reliable, existing calculation logic.
Feature Highlights
-
Automatic Activation: When you click the Trends toggle, the following calculations are instantly activated:
-
Max
-
Min
-
Average
-
Rate of Change (RoC)
-
-
RoC Display: The Rate of Change calculation is automatically plotted on the right axis for better visibility.
-
Smart Default Configuration: Auto-activated calculations use:
-
Interval: 7 days
-
Unit: 1 day
-
-
Easy Toggle Control: Click the Trends button to turn the visualization ON or OFF. When OFF, all associated calculation lines (Max, Min, Avg, RoC) are removed.
-
Multi-Selection Support: Allows selecting multiple instruments and fields for enhanced comparative trend analysis.
-
Reliable Logic: Built on our existing calculation engine, ensuring accuracy and consistency.
Please note this feature is available for use on all sensor graphs EXCEPT those belonging to Inclinometers/IPIs
How Does It Work?
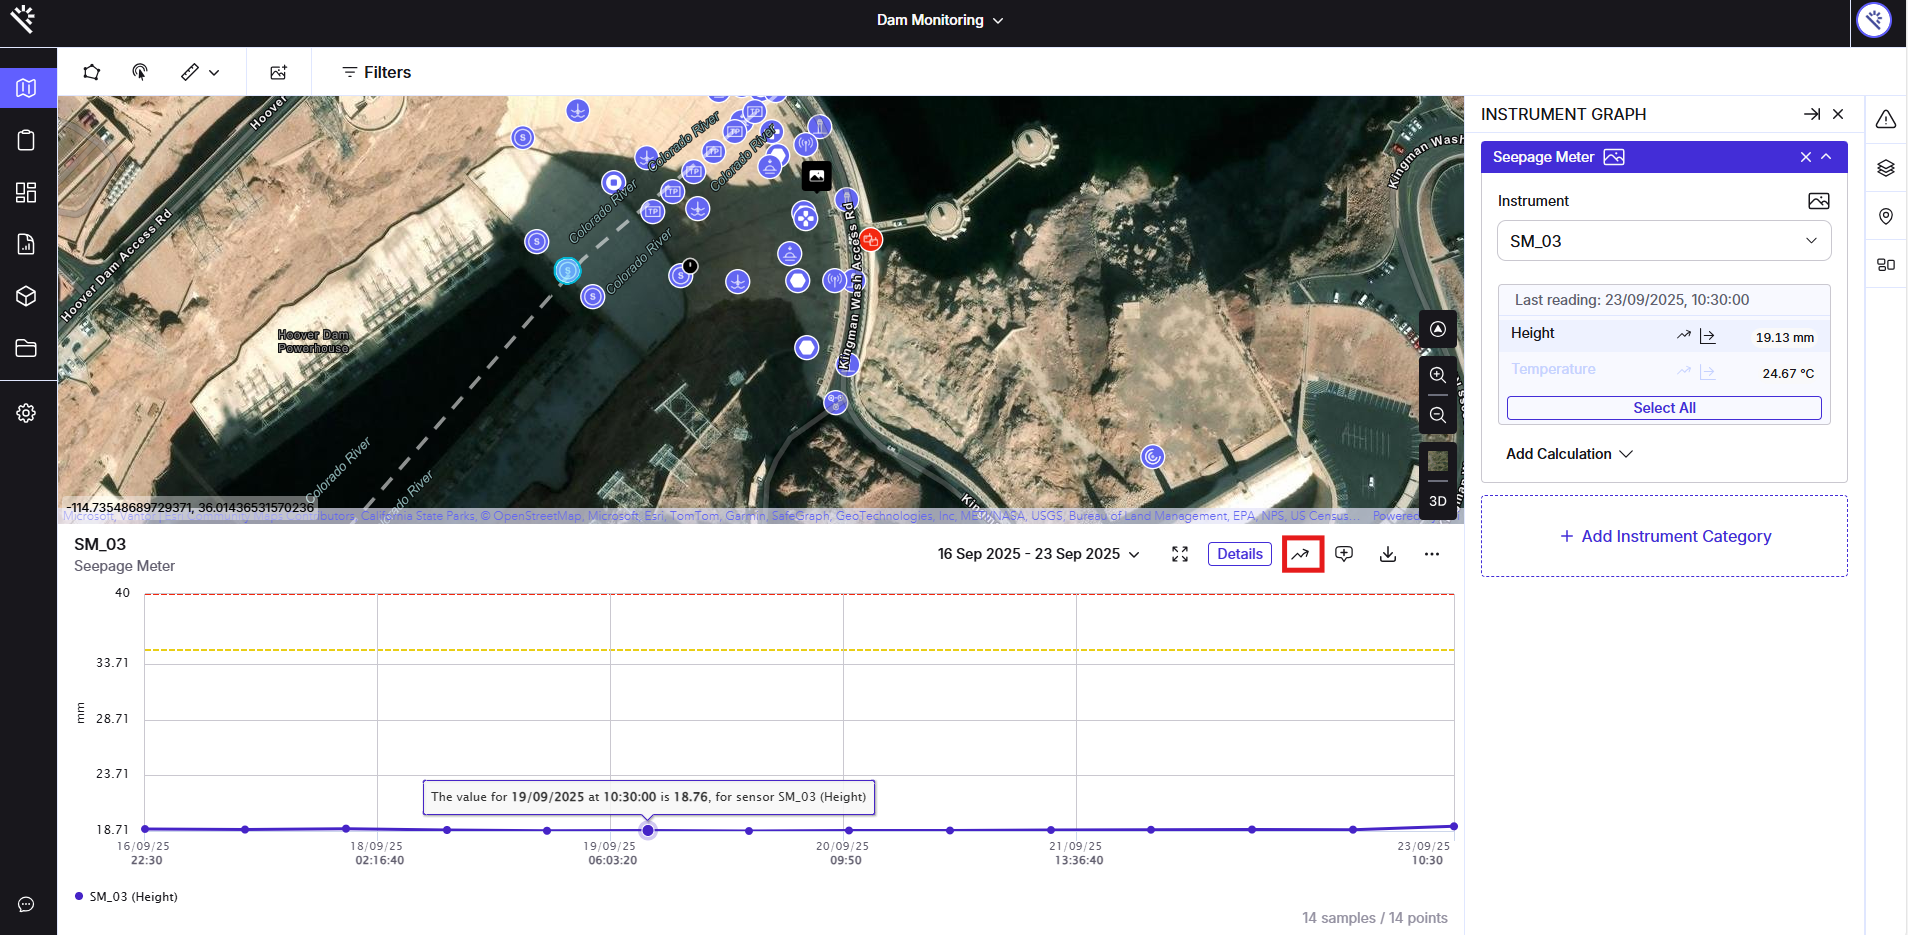
1. Open a Graph
Open any non-inclinometer instrument graph from the map.

2. Toggle Trends
Locate and toggle the Trends button at the top right corner of the graph.
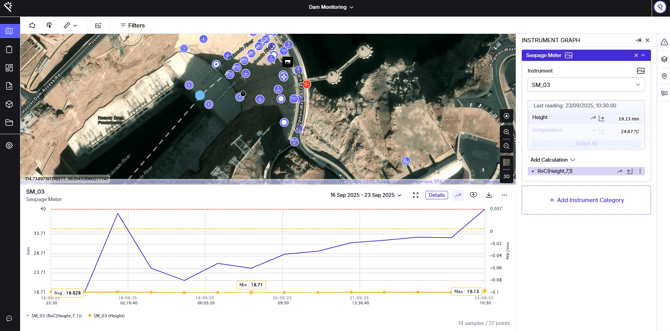
3.View Instant Analysis
Click the Trends toggle button. The trend visualization will appear, and the system will automatically plot the:
-
Max line
-
Min line
-
Average line
-
Rate of Change line (displayed on the right axis)
These calculations are instantly applied using the default 7-day interval and 1-day unit.
4. Toggle Off
Click the Trends button again to disable the visualization and automatically remove all calculation lines from the graph.