
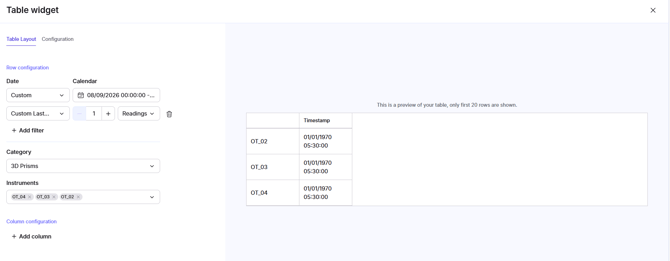
Why is this functionality useful?
Different monitoring scenarios require different ways of viewing data. While fixed date ranges are useful for historical analysis, live monitoring often requires dynamic filters that automatically update as new data becomes available.
With the Table Widget Hybrid Date Filters, users can:
- Create fixed historical views using exact start and end dates.
- Automatically display data from a rolling time period.
- View only the most recent readings from each instrument.
- Quickly switch between different filtering methods.
- Reset filters to return to the default view.
- Efficiently work with large, high-frequency datasets.
Feature Highlights
Absolute Date Range
Select specific Start and End dates to display data from a fixed period. This is particularly useful for historical analysis, audits, and compliance reports.
Relative Date Filters
Use dynamic time windows such as Last X Days or Last X Periods. The table automatically updates as time progresses, eliminating the need to manually adjust the date range.
For example, selecting Last 7 Days will always display data from the most recent seven-day period.
Latest X Readings
Configure the table to display only the Latest X Readings for each instrument. This is useful for quickly monitoring current site conditions regardless of how frequently individual instruments send data.
For example, selecting Latest 5 Readings will display the five most recent readings available for each instrument.
Unified Filter Panel
All filtering options are available from the same date selection panel, allowing users to easily switch between:
- Absolute — fixed Start/End dates.
- Relative — rolling time periods.
- Latest Readings — a defined number of recent readings.
Easy Filter Removal
Applied filters can be cleared with a single click, allowing users to quickly return to the default table view.
Optimized Performance
The new filtering functionality is designed to provide fast table updates and smooth navigation, including when working with large volumes of high-frequency monitoring data.
How does it work?
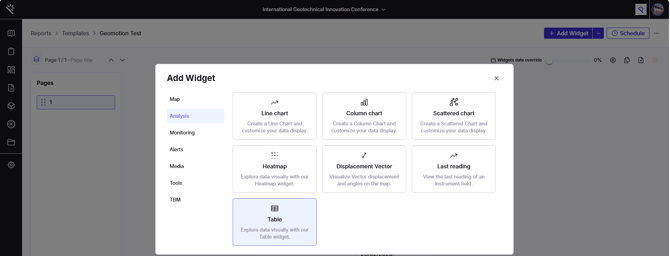
Step 1: Open the Table Widget
Open the configuration modal for any Table Widget within a Report or Dashboard.
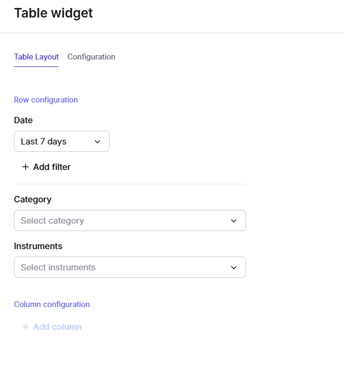
Step 2: Open the Filter Settings
Locate the date and filter selection panel at the top of the configuration window.
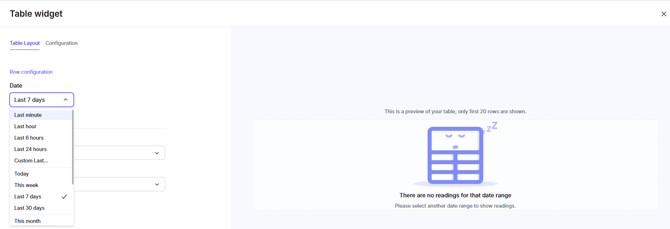
Step 3: Choose the Filter Mode
Select the option that best matches your requirements:
- Absolute: Enter a fixed Start and End date.
- Relative: Select a rolling period, such as Last 7 Days or Last 30 Days.
- Latest Readings: Specify the number of readings to display, such as Latest 5 Readings.
Step 4: Apply and Save
Save the configuration. The table will immediately update to display the data according to the selected time window or reading threshold.
Key Benefits
- Flexible filtering using dates, relative periods, or reading counts.
- Automatically updating rolling time windows.
- Quick access to the latest available instrument readings.
- Suitable for both reports and dashboards.
- Simple switching between filter modes.
- Easy filter removal and reset.