Why is this functionality useful?
In inclinometer monitoring, understanding displacement changes over time is crucial. By anchoring all values to the initial reading of your selected time range, users can easily interpret overall displacement without noise from raw values. This simplifies trend analysis, supports decision-making, and helps identify early warnings or long-term shifts in ground or structural behavior.
Feature Highlights
-
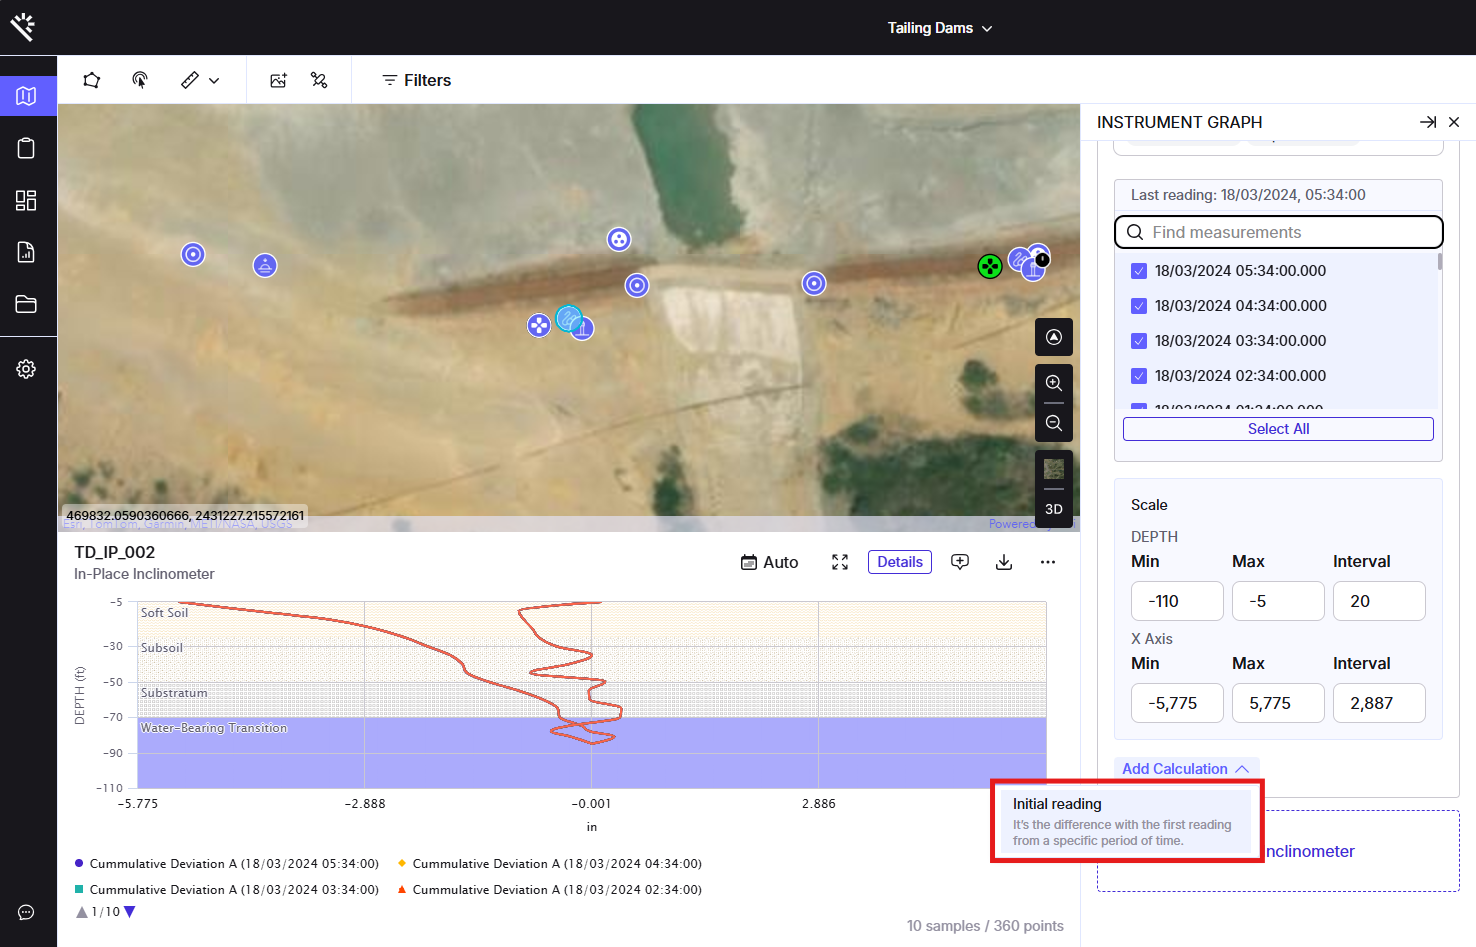
Initial Reading Baseline: Uses the first reading within the selected time range as the reference point for all calculations.
-
Overall Displacement View: Clearly see the total accumulated movement during the monitoring period.
-
Clean Visualization: When the relative calculation is applied, raw readings are automatically hidden, allowing a focused view that shows only the relative calculation lines.
How does it work?
-
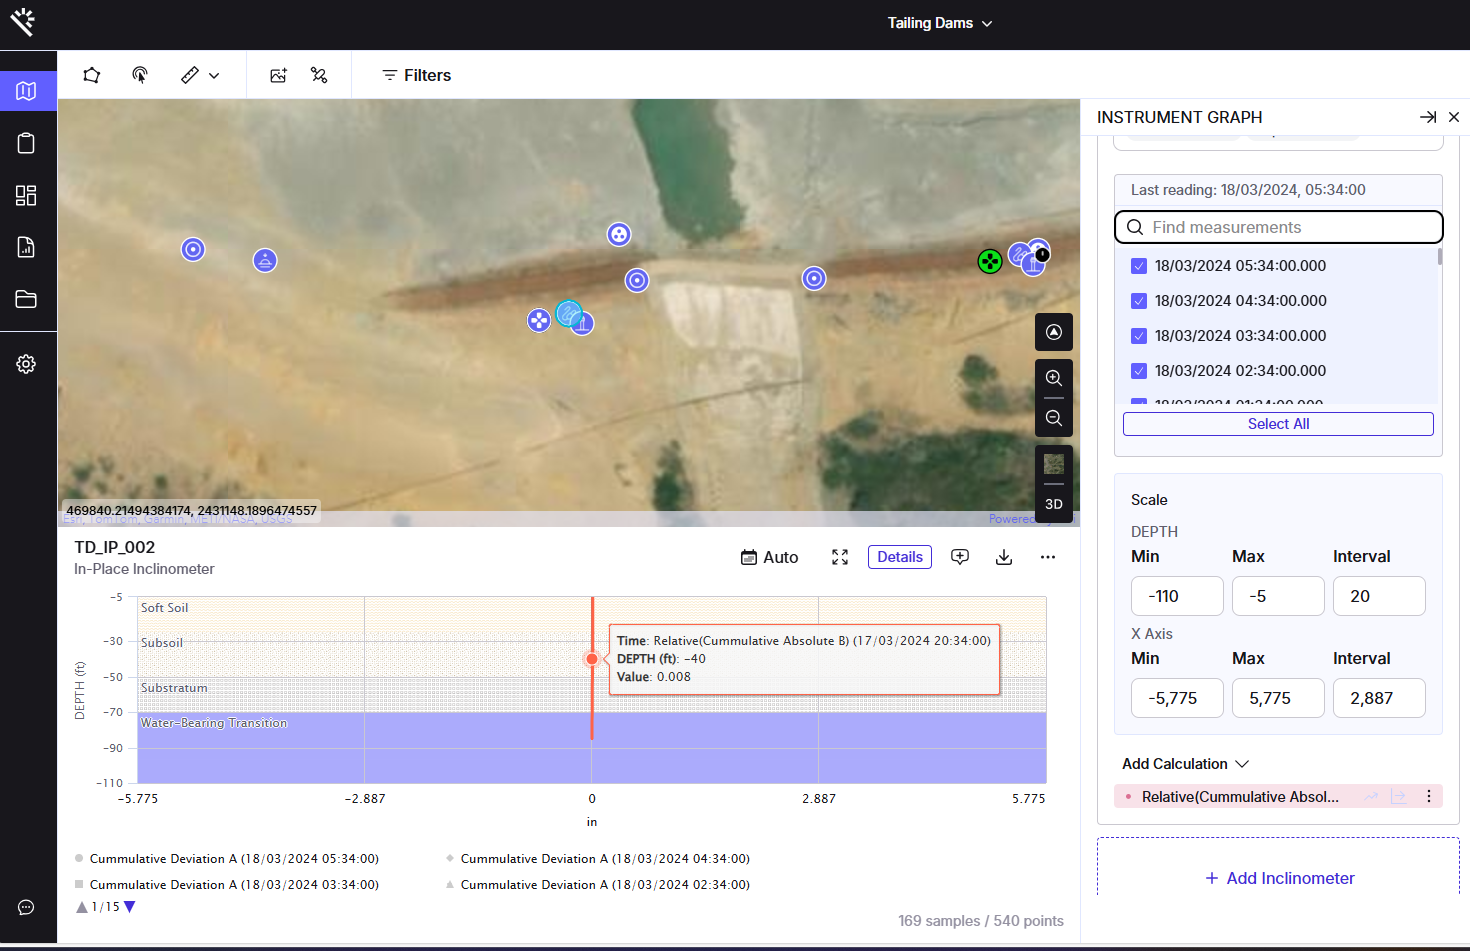
Access Inclinometer Graph:
-
Open any inclinometer graph from the map view.
-

-
Navigate to Calculations:
-
Open the graph’s calculation settings to access available calculation modes.
-
-
Select Relative Option:
-
Choose the “Relative” calculation mode to activate the feature.
-
-
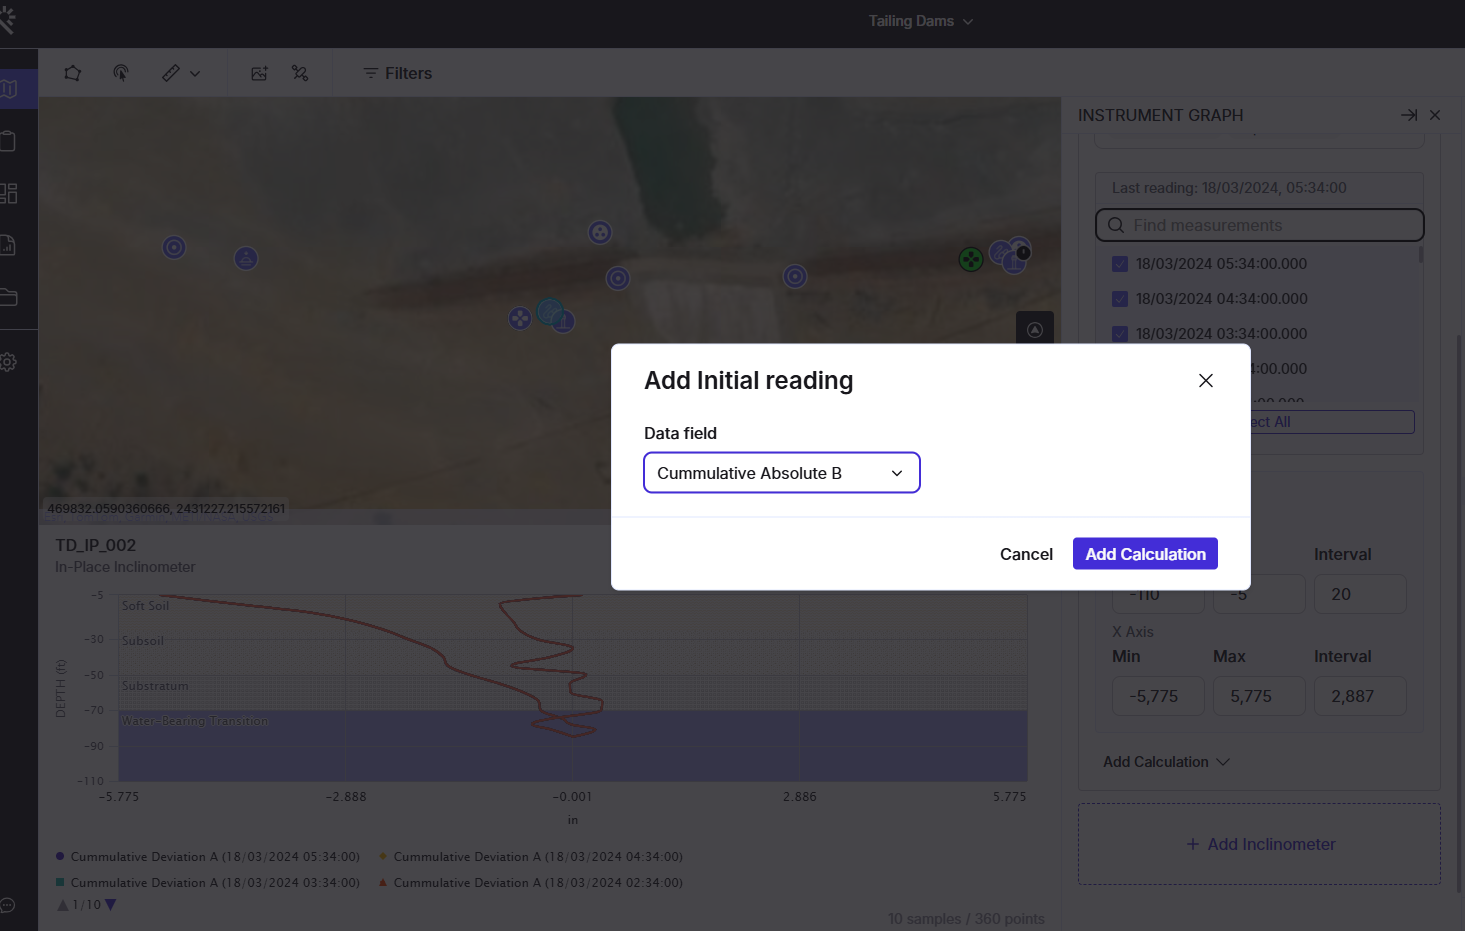
Baseline Selection:
-
After you choose which field you would like to apply this calculation to, the system automatically selects the pertinent Initial Reading (the first data point within your chosen time range) as the baseline for comparison.
-
-
View Results:
-
The chart updates to display displacement relative to that initial reading.
-
Raw reading lines are hidden so the relative calculation lines remain clear and easy to interpret.
-