---
title: Lines and Textures Feature
description: Learn how to add lines and textures to Proqio graphs
---
[Skip to content](https://help.proqio.com/lines-and-textures-feature#main-content)
[](https://help.proqio.com/?hsLang=en)
Open main navigation
Close main navigation
How can we help you?
- There are no suggestions because the search field is empty.
1. [Knowledge base](https://help.proqio.com/?hsLang=en)
2. [Lines and Textures](https://help.proqio.com/lines-and-textures?hsLang=en)
# Lines and Textures Feature
## Using Lines and Textures on graphs in Proqio can significantly enhance data visualization and make it easier to interpret important levels, limits, thresholds, and data ranges.
### Navigation
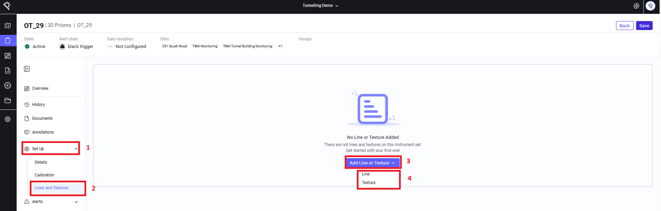
To access the **Lines and Textures** feature:
1. Navigate to **Instrument Setup**.
2. Open the **Lines and Textures** option.
3. Click the **Add Lines or Texture** dropdown.
4. Select either **Line** or **Texture**.
---
### How to Add Lines
Lines can be used to mark a specific value or reference level on a graph.
#### Steps
1. Select **Line** from the dropdown by following the [navigation](https://help.proqio.com/lines-and-textures-feature#Navigation).
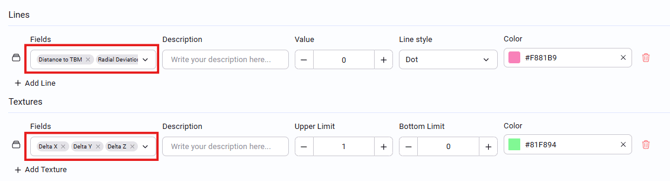
2. Select the **field** to which you want to apply the line.

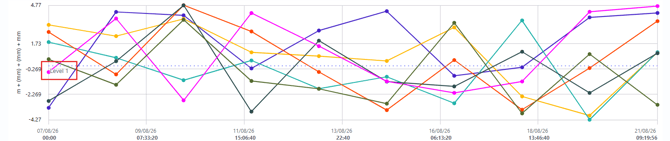
3. Add a **description** of what you want the line to represent. This desciption will appear as text adjacent to the line.

4. Enter the **value** at which you want the line to appear.
5. Select the required **line style**:
- **Dot**
- **ShortDash**
- **Solid
**
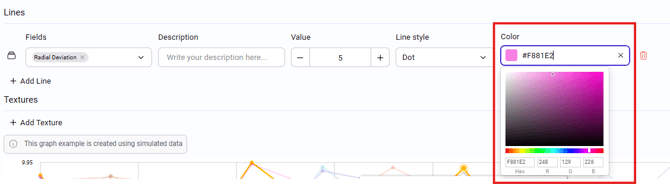
6. Select the desired **color** for the line.
7. Click **Save** to apply the changes.

You can use the **Add Line** option to add multiple reference lines to the same graph.
---
### How to Add Textures
Textures can be used to highlight a specific range or area on a graph, making it easier to identify important zones or operating ranges.
#### Steps
1. Select **Texture** from the dropdown by following the [navigation.](https://help.proqio.com/lines-and-textures-feature#Navigation)
2. Select the **field** to which you want to apply the texture.
3. Add a **description** of what you want the line to represent. This desciption will appear as text adjacent to the line.
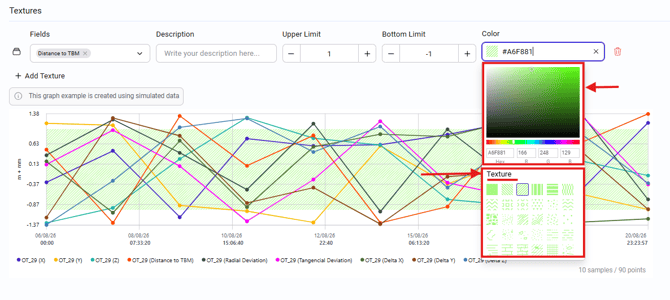
4. Enter the **Upper Limit** and **Bottom Limit** to define the range where the texture should be displayed.

5. From the **Color** option, select the desired color and texture.
- Click **Save** to apply the changes.
You can use the **Add Texture** option to add multiple textured ranges to the graph.
**Note:** In case the Upper/Lower limits or values are the same for multiple parameters/fields, you can select multiple fields at once when adding lines or textures.
- [Getting started](https://help.proqio.com/getting-started?hsLang=en#main-content)
- [Project details](https://help.proqio.com/getting-started?hsLang=en#project-details)
- [Teams and members](https://help.proqio.com/getting-started?hsLang=en#teams-and-members)
- [Account](https://help.proqio.com/getting-started?hsLang=en#account)
- [Configure Your Instruments](https://help.proqio.com/getting-started?hsLang=en#configure-your-instruments)
- [Notifications](https://help.proqio.com/getting-started?hsLang=en#notifications)
- [Connectivity methods](https://help.proqio.com/getting-started?hsLang=en#connectivity-methods)
- [Alerts](https://help.proqio.com/getting-started?hsLang=en#alerts)
- [Map](https://help.proqio.com/map?hsLang=en#main-content)
- [Tools](https://help.proqio.com/map?hsLang=en#tools)
- [Analysis](https://help.proqio.com/map?hsLang=en#analysis)
- [Monitoring](https://help.proqio.com/monitoring?hsLang=en#main-content)
- [Instruments](https://help.proqio.com/monitoring?hsLang=en#instruments)
- [Dashboard Creation & Configuration](https://help.proqio.com/dashboard-creation-configuration?hsLang=en#main-content)
- [Dashboards](https://help.proqio.com/dashboard-creation-configuration?hsLang=en#dashboards)
- [Report Creation](https://help.proqio.com/report-creation?hsLang=en)
- [New Feature Releases](https://help.proqio.com/new-feature-releases?hsLang=en)
- [Project Hierarchy](https://help.proqio.com/project-hierarchy?hsLang=en)
- [Analyse and Interpret your Data](https://help.proqio.com/analyse-and-interpret-your-data?hsLang=en)
- [Learn How to Navigate Proqio](https://help.proqio.com/learn-how-to-navigate-proqio?hsLang=en)
- [Configure Your Map View](https://help.proqio.com/configure-your-map-view?hsLang=en)
- [How to Add a Real Time Picture on Map](https://help.proqio.com/how-to-add-a-real-time-picture-on-map?hsLang=en)
- [Managing Your Data](https://help.proqio.com/managing-your-data?hsLang=en)
- [Uploading Records Manually](https://help.proqio.com/uploading-records-manually?hsLang=en#main-content)
- [Steps for uploading instrument data records manually](https://help.proqio.com/uploading-records-manually?hsLang=en#steps-for-uploading-instrument-data-records-manually)
- [ADA](https://help.proqio.com/ada?hsLang=en)
- [Digital Twin](https://help.proqio.com/digital-twin?hsLang=en)
- [Lines and Textures](https://help.proqio.com/lines-and-textures?hsLang=en)
[](http://www.proqio.com?hsLang=en)
Copyright © 2026, Proqio