---
title: Linear Alert Function
description: Learn how to configure Linear Alert Functions in Proqio to create custom multi-point alert thresholds, define trigger conditions, and visually validate alert boundaries.
---
[Skip to content](https://help.proqio.com/linear-alert-function#main-content)
[](https://help.proqio.com/?hsLang=en)
Open main navigation
Close main navigation
How can we help you?
- There are no suggestions because the search field is empty.
1. [Knowledge base](https://help.proqio.com/?hsLang=en)
2. [Getting started](https://help.proqio.com/getting-started?hsLang=en)
3. [Alerts](https://help.proqio.com/getting-started?hsLang=en#alerts)
# Linear Alert Function
## The Linear Alert Function allows users to define custom upper and lower alert thresholds using multiple X,Y coordinate pairs. This functionality provides both flexible threshold configuration and visual validation through an interactive graph.
### Why is this functionality useful?
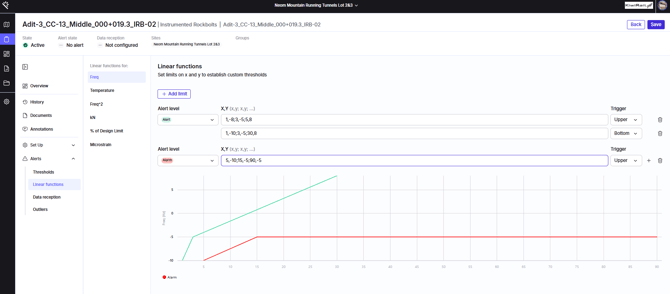
Linear alert functions allow users to define alert boundaries that follow a custom linear geometry rather than relying on a single fixed threshold.
This is particularly useful when alert limits vary depending on factors such as depth, distance, or another X-axis parameter.
With this functionality, users can:
- Define multi-point alert boundaries.
- Configure different alert levels for individual threshold lines.
- Specify whether a limit triggers above or below the defined boundary.
- Configure multiple limits for the same alert level.
- Visually validate threshold geometry before saving.
---
### Feature Highlights
### Coordinate-Based Threshold Input
Define custom linear boundaries using multiple X,Y coordinate pairs. Coordinates should be entered using the following format:
`x,y; x,y;`
For example:
`0,0; -1,1; -5,8;`
### Multi-Level Alert Assignment
Each threshold line can be assigned to a specific alert level, such as **Action** or **Alarm**, using the Alert Level dropdown.
### Directional Trigger Rules
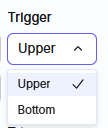
The **Trigger** selector determines how the system evaluates readings against the defined boundary:
- **Upper:** Triggers when values exceed or cross above the linear boundary.
- **Bottom / Lower:** Triggers when values drop below the linear boundary.
### Multiple Limits
Multiple threshold lines can be configured for the same alert level. Use the **+** icon to add additional limits within an alert block, or **+ Add limit** to create a new threshold block.
### Real-Time Visualization
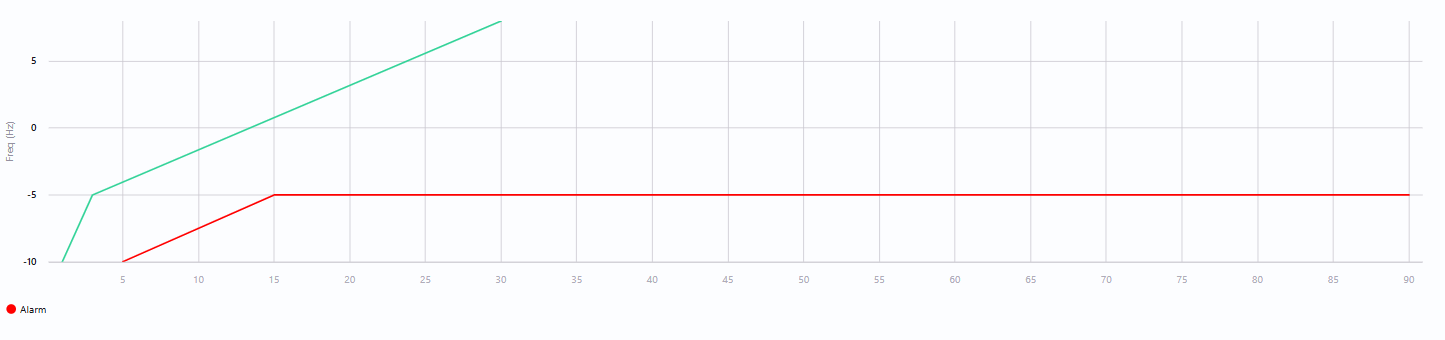
The configured coordinates are displayed on an interactive Cartesian graph, allowing users to visually verify the threshold geometry before saving the configuration.
---
### How does it work?
### Step 1: Open Linear Functions
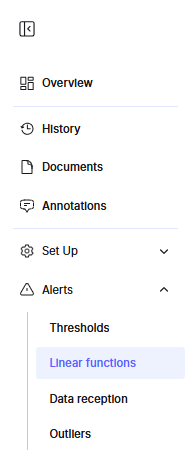
Navigate to **Instrument Settings \> Alerts \> Linear Functions**.
### Step 2: Add a Limit
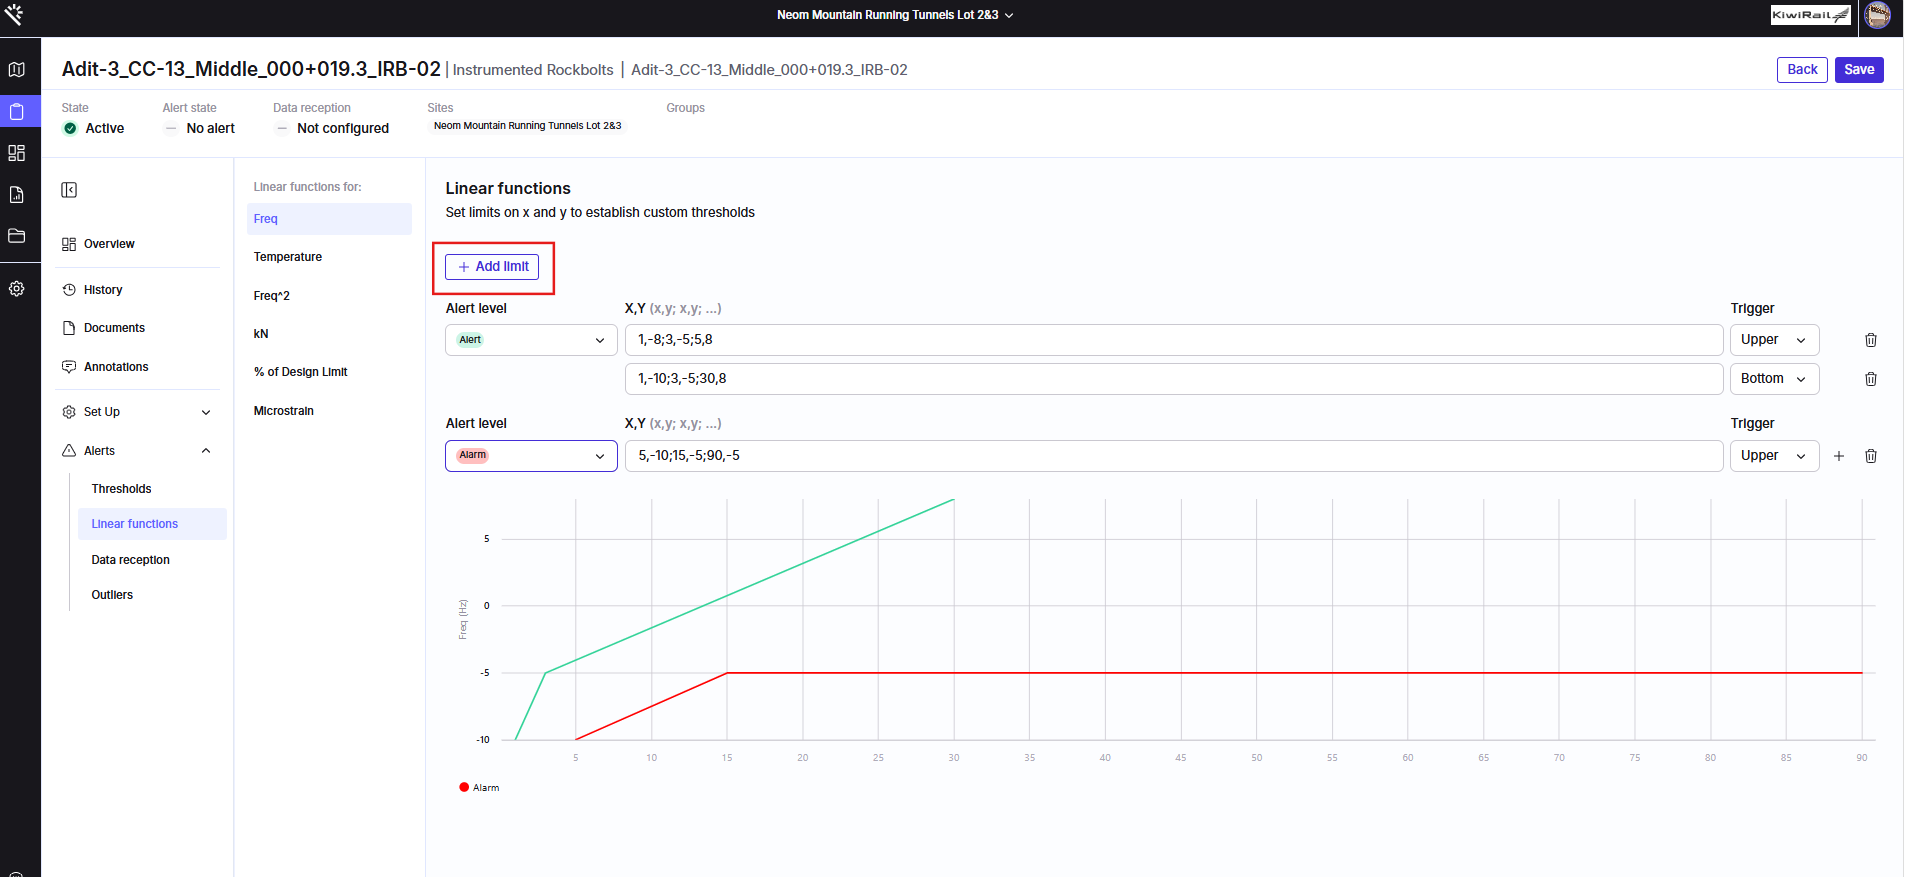
Click **+ Add limit** to create a new threshold block, or select an existing limit to modify it.
### Step 3: Select the Alert Level
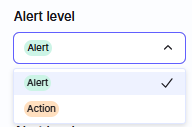
Choose the desired **Alert Level**, such as **Action** or **Alarm**.
### Step 4: Enter the Coordinates
Enter the X,Y coordinate pairs in the designated field using the required format:
`x,y; x,y;`
For example:
`0,0; -1,1; -5,8;`
### 
### Step 5: Define the Trigger
Select the appropriate **Trigger** condition:
- **Upper** — triggers above the boundary.
- **Bottom / Lower** — triggers below the boundary.
### Step 6: Verify the Threshold
Review the threshold line on the preview graph to confirm that the configured coordinates produce the expected boundary.
### Step 7: Save the Configuration
Once the configuration has been verified, save the changes to apply the linear alert function.
---
### Key Benefits
- Flexible, multi-point alert threshold configuration.
- Enables applying different alert levels and trigger directions.
- Ability to configure multiple limits within the same alert level.
- Visual validation of threshold boundaries before saving.
- Greater control over complex, variable alert conditions.
- [Getting started](https://help.proqio.com/getting-started?hsLang=en#main-content)
- [Project details](https://help.proqio.com/getting-started?hsLang=en#project-details)
- [Teams and members](https://help.proqio.com/getting-started?hsLang=en#teams-and-members)
- [Account](https://help.proqio.com/getting-started?hsLang=en#account)
- [Configure Your Instruments](https://help.proqio.com/getting-started?hsLang=en#configure-your-instruments)
- [Notifications](https://help.proqio.com/getting-started?hsLang=en#notifications)
- [Connectivity methods](https://help.proqio.com/getting-started?hsLang=en#connectivity-methods)
- [Alerts](https://help.proqio.com/getting-started?hsLang=en#alerts)
- [Map](https://help.proqio.com/map?hsLang=en#main-content)
- [Tools](https://help.proqio.com/map?hsLang=en#tools)
- [Analysis](https://help.proqio.com/map?hsLang=en#analysis)
- [Monitoring](https://help.proqio.com/monitoring?hsLang=en#main-content)
- [Instruments](https://help.proqio.com/monitoring?hsLang=en#instruments)
- [Dashboard Creation & Configuration](https://help.proqio.com/dashboard-creation-configuration?hsLang=en#main-content)
- [Dashboards](https://help.proqio.com/dashboard-creation-configuration?hsLang=en#dashboards)
- [Report Creation](https://help.proqio.com/report-creation?hsLang=en)
- [New Feature Releases](https://help.proqio.com/new-feature-releases?hsLang=en)
- [Project Hierarchy](https://help.proqio.com/project-hierarchy?hsLang=en)
- [Analyse and Interpret your Data](https://help.proqio.com/analyse-and-interpret-your-data?hsLang=en)
- [Learn How to Navigate Proqio](https://help.proqio.com/learn-how-to-navigate-proqio?hsLang=en)
- [Configure Your Map View](https://help.proqio.com/configure-your-map-view?hsLang=en)
- [How to Add a Real Time Picture on Map](https://help.proqio.com/how-to-add-a-real-time-picture-on-map?hsLang=en)
- [Managing Your Data](https://help.proqio.com/managing-your-data?hsLang=en)
- [Uploading Records Manually](https://help.proqio.com/uploading-records-manually?hsLang=en#main-content)
- [Steps for uploading instrument data records manually](https://help.proqio.com/uploading-records-manually?hsLang=en#steps-for-uploading-instrument-data-records-manually)
- [ADA](https://help.proqio.com/ada?hsLang=en)
- [Digital Twin](https://help.proqio.com/digital-twin?hsLang=en)
- [Lines and Textures](https://help.proqio.com/lines-and-textures?hsLang=en)
[](http://www.proqio.com?hsLang=en)
Copyright © 2026, Proqio