Why is this functionality useful?
Proqio´s displacement vector feature enables users to clearly visualize both the magnitude (how much movement occurred) and the direction (in which way the ground or structure is shifting) of the changes in position that have been recorded by the sensors in a given project.
Feature Highlights
- Enables Movement Tracking Over Time : This feature captures both the magnitude and directions of structural shifts from the information provided in the sensor measurements.
- Understand Displacement Patterns: Clearly separate different displacement patterns such as settlement and lateral spread.
- Enhanced Risk Detection: Identify displacement trends that may indicate site instability.
- Clear Visual Analysis: Displaying displacement vectors on maps enables intuitive data interpretation.
How does the Displacement Vectors Feature work?
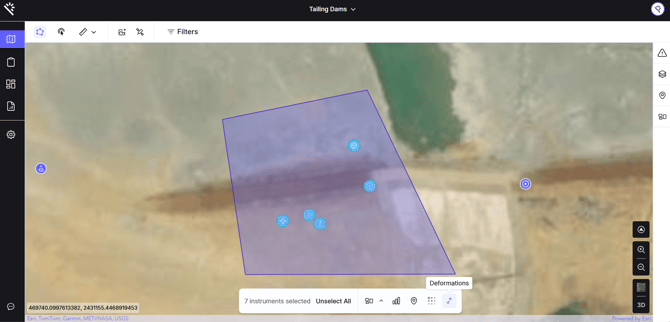
- Select an area on the map that contains the instruments you would like to analyse.
- Click on the Displacement Vector button in the map toolbar.
- A modal will appears with four inputs:
- Category: Choose the category to use for displacement vectors. Instruments not in this category will be hidden.
- Bearing: A global rotation (in degrees) added to all computed vector angles.
- X: Field from the chosen category used as the X component for calculations.
- Y: Field from the chosen category used as the Y component for calculations.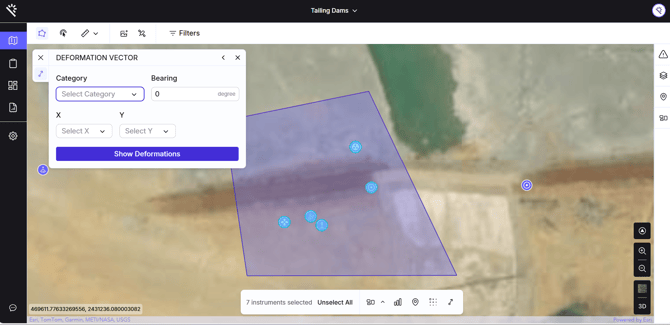
- Vectors and a histogram will appear after clicking the button "show deformation".
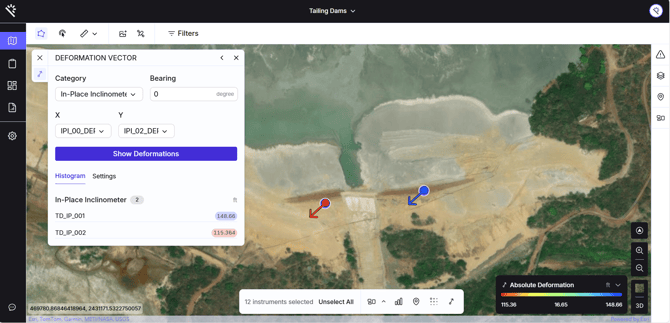
Users must note that the colours shown are proportionate to the magnitude of deformation or displacement.
Settings
- Color palette: Choose from different color palettes to customize the appearance of the vectors.
- Opacity: Adjust the layer’s opacity from 0% (fully transparent) to 100% (fully opaque).
- Legend limits: Users can modify the legend limits, but cannot shorten the original range. If the maximum or minimum limit is changed within the original range, the vectors are automatically recalculated to adjust the colors accordingly.
Understanding The Calculations
Displacement vectors are represented as arrows on the map, showing both the magnitude (colour) and direction (angle) of deformation or displacement. These arrows are derived directly from instrument-provided X and Y values.
Magnitude (arrow colour)
-
The arrow colour represents how large the displacement is, meaning its magnitude.
- The magnitude is calculated using the Pythagoras formula, and the result is always a positive number
![]()
- In Proqio, larger magnitudes correspond to stronger colors, with color shading determined by the dynamic color palette.
Angle (arrow direction)
-
The angle represents the direction the displacement is pointing towards. It is calculated using the standard mathematical convention θ=atan2(y,x), which measures angles from the positive X-axis in an anticlockwise direction.
-
For map visualization, angles are converted so that:
-
0° aligns with the positive Y-axis (north)
-
Angles increase clockwise
-
- This ensures that the arrows are displayed correctly on the map.
Bearing (user adjustment)
- Users can apply a global rotation to all arrows.
- Example: setting the bearing to 90° rotates every arrow 90° clockwise relative to its calculated orientation.
Visualization
-
Arrow angle = direction of movement.
-
Arrow color = scaled by magnitude (e.g., small displacements in green, large in red).