1. Control the number of data points per widget
One of the main factors affecting report performance is the total number of data points included in a widget.
As a general rule, try to avoid exceeding 10,000 data points per widget. When this threshold is surpassed, the system may struggle to retrieve and render the data efficiently.
You can estimate the number of data points by considering:
- The number of instruments included
- The frequency of readings
- The selected time range
Combining multiple instruments over long periods can also quickly result in very large datasets.
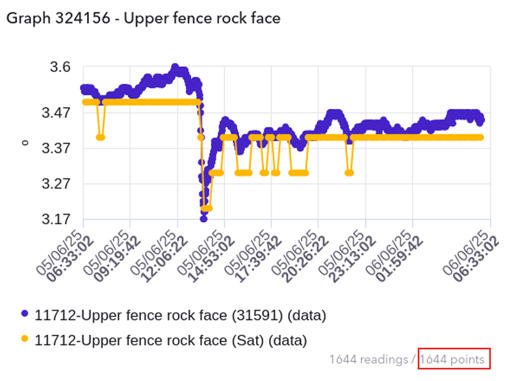
Additionally, you can find the number of data points that a widget contains below the graph, as can be see in the highlighted section of the example below.
2. Pay special attention to data-heavy instruments
Some instruments can generate large datasets either due to their structure or the frequency at which they record data.
In particular:
- Inclinometers / Shape Arrays can produce a high number of data points because each segment contributes readings
- Dynamic Monitoring Sensors succh as Accelerometers, Seismographs, Vibration Sensors and other high-frequency instruments can rapidly accumulate data even over short time periods
When working with these types of instruments, it’s especially important to:
- Limit the selected time range
- Be selective about which data is included in each graph
3. Design reports with performance in mind
A good report is not necessarily the one with the most data, but the one that presents relevant information efficiently.
Some general recommendations:
- Use multiple smaller/less data heavy widgets instead of a single large one where possible
- Adjust time ranges based on the purpose of the report
- Focus on the most relevant data for your audience
- If you need to include a large number of sensors in your report, some recommendations are:
- Selecting a shorter date range
- Grouping small batches of sensors in separate graph widgets
Final note
If you’re unsure whether your report configuration may be too heavy, our support team is always available to help you optimize it.